| |
 |
![]()
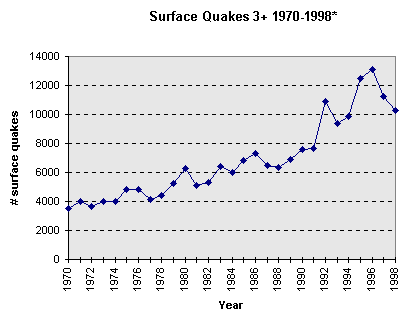
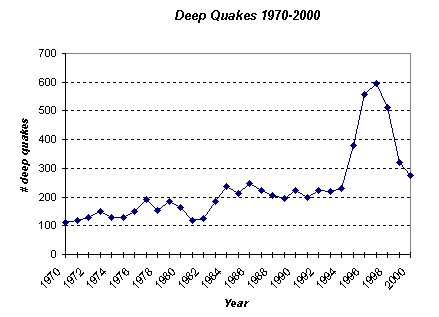
After executing queries for Richter 3+ Quakes from 1970-1998, and again for Richter 5+ Quakes 1970-1998 we can see an exponential increase in earthquakes in general and a relatively stable incidence of Richter 5+ earthquakes. I conclude that earthquakes are on the increase, however, all of this increase to 1998 falls to weaker earthquakes (below Richter 5). Both graphs also show an interesting significant decrease in earthquakes in 1999. While this may indicate a "cooling down", there's another interpretation. If you look at the Richter 3+ graph more closely, you will see that after every increase there was a decrease followed by a stronger increase. If we assume this pattern to continue, we may expect that we're currently in a "silence before a storm" and that the earthquakes will drastically increase later, probably including an increase in higher Richter earthquakes.


Richter 3+ Quakes 1970-7/1998 Richter 5+ Quakes 1970-7/1998 1970 3504
1971 3980
1972 3670
1973 4010
1974 3991
1975 4821
1976 4805
1977 4121
1978 4408
1979 5223
1980 6295
1981 5113
1982 5344
1983 6431
1984 5998
1985 6834
1986 7310
1987 6496
1988 6315
1989 6907
1990 7553
1991 7636
1992 10884
1993 9400
1994 9830
1995 12495
1996 13112
1997 11273
7/1998 103001970 1097
1971 1198
1972 1167
1973 1174
1974 1174
1975 1281
1976 1447
1977 1451
1978 1272
1979 1130
1980 1130
1981 953
1982 1173
1983 1460
1984 1256
1985 1410
1986 1393
1987 1188
1988 1181
1989 1189
1990 1382
1991 1214
1992 1316
1993 1262
1994 1333
1995 1211
1996 1164
1997 940
7/1998 708
Offered by Kiko.